





To read an OTDR trace, follow the line from left to right. The horizontal axis is distance along the fiber. The vertical axis is backscattered power in dB. A steady downward slope is normal fiber attenuation. A sudden step down is a loss event, such as a splice or a bend. A spike is a reflection, usually from a connector or an open fiber end. Where the line drops into noise, the fiber ends. Every OTDR then turns that line into an event table that lists the distance, loss and reflectance of each event.
This guide uses real traces from a 7.08 km test link, measured with a TFN F7 OTDR. You can check every number against the screenshots.
What an OTDR Trace Actually Shows
An OTDR sends short laser pulses into the fiber. It then measures the light that comes back over time. Two kinds of light return:
- Rayleigh backscatter. The glass itself scatters a small amount of light back toward the instrument all along the fiber. This produces the gently sloping baseline.
- Fresnel reflection. A sudden change in refractive index, such as an air gap at a connector or a cleaved end, reflects a burst of light. This shows up as a spike.
The OTDR converts return time into distance using the fiber’s index of refraction (IOR). Because the light travels out and back, the instrument halves both the time and the loss. That is why the distance and dB values on the screen are one-way figures.
Two practical points follow from this.
First, the OTDR measures fiber length, not cable length. Cable contains extra fiber, so a break shown at 5.06 km may sit somewhat closer along the cable route. Check route records before you dig.
Second, an OTDR is an indirect measurement. The Fiber Optic Association notes that many standards still require an insertion-loss test with a light source and power meter for loss certification. Use the OTDR to find où loss happens and what causes it.
Anatomy of a Real Trace, Left to Right
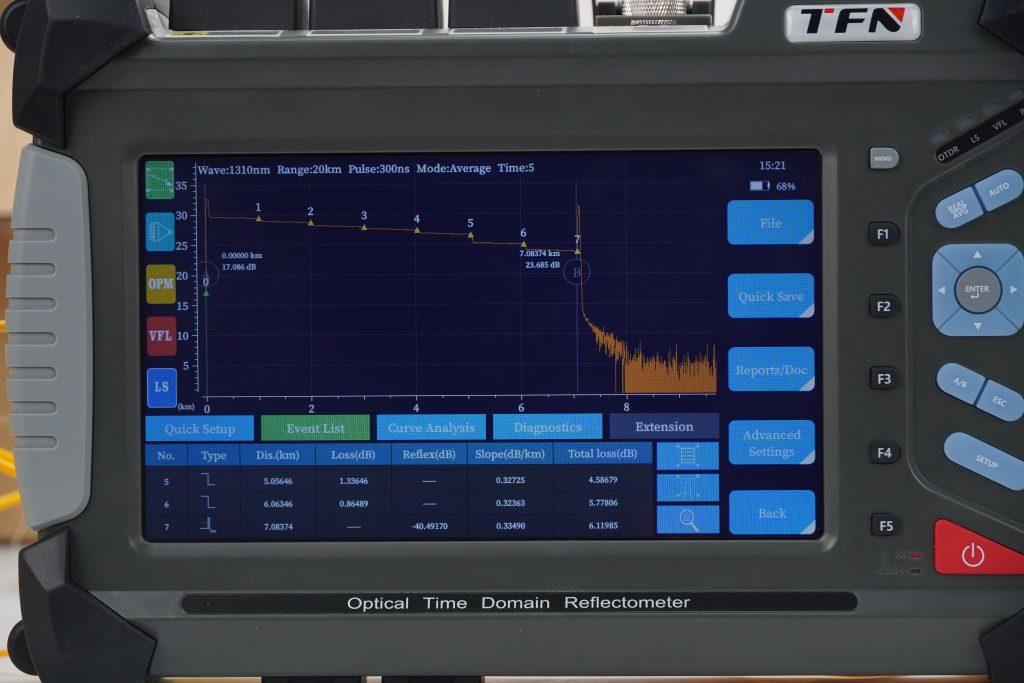
The trace above was taken at 1310 nm, 20 km range, 300 ns pulse width, averaging mode. These settings are printed across the top of the screen. Read the trace in four zones.
- Launch zone (0 km). The tall spike at the far left is the OTDR’s own front connector, marked event 0. Its reflectance reads –51.09 dB. Right after it is a short dead zone, where the detector is still recovering from that reflection.
- Fiber sections. Between events, the line slopes down evenly. The event table reports a slope of about 0.33 dB/km at 1310 nm. A uniform slope means healthy fiber. A section that is steeper than its neighbours points to stressed or different fiber.
- Events 1–6. Each is a small step down with no spike. These are non-reflective events, typically fusion splices, here roughly every kilometre. Event 5 at 5.06 km is visibly deeper than the others.
- End of fiber (event 7, 7.08 km). There is a reflective spike, and then the trace falls into the noise floor. That noisy tail on the right is not fiber. It is the instrument’s noise floor.
How to Identify Each OTDR Event
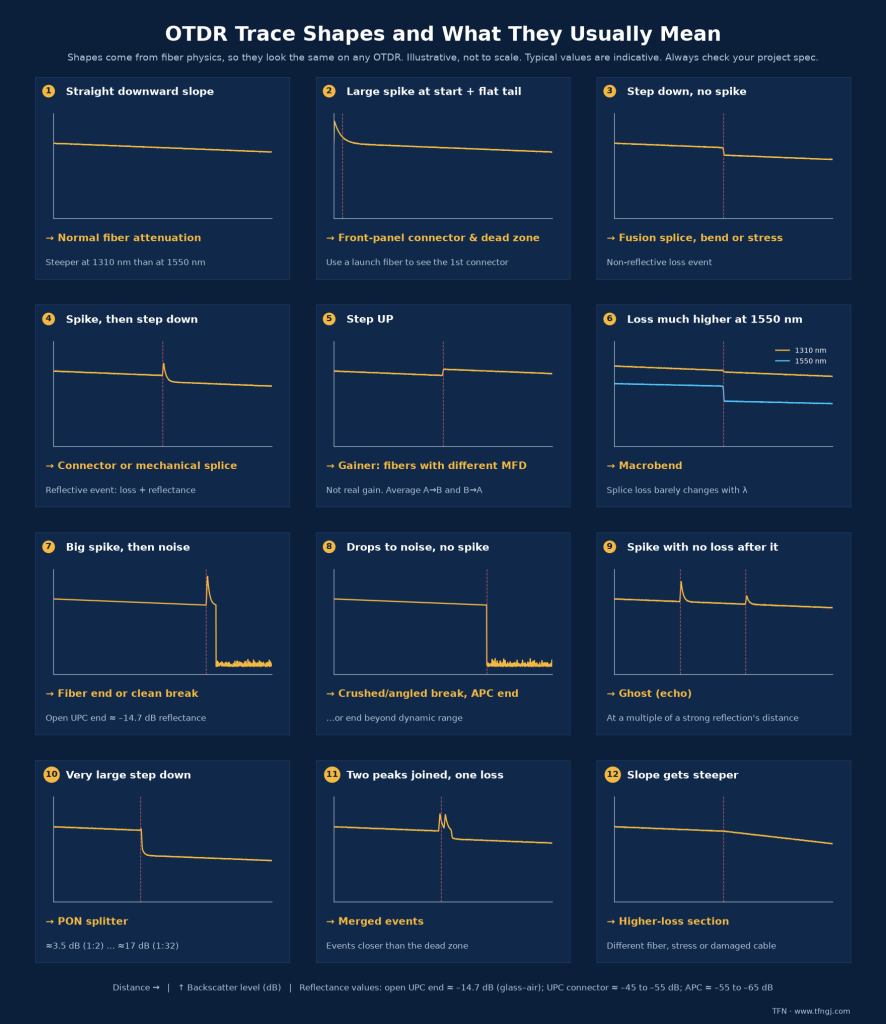
Most events fall into a few shapes. Learn the shape first, then confirm it with the numbers.
| Event | What it looks like | Typical cause | What to check |
|---|---|---|---|
| Non-reflective | Step down, no spike | Fusion splice, bend | Loss value |
| Reflective | Spike, then step down | Connector, mechanical splice, crack | Loss and reflectance |
| Fiber end | Spike or drop into noise | Open end, break | Distance against expected length |
| Macrobend | Non-reflective step, bigger at 1550 nm | Tight bend, crushed cable | Compare 1310 and 1550 nm |
| Gainer | Upward step | Splice between fibers with different mode field diameter | Test in both directions |
| Ghost | Spike with almost no loss | Echo of a strong reflection | Distance is a multiple of a real event |
| Merged | One wide event | Two events closer than the dead zone | Retest with a shorter pulse |
Reflective events and typical reflectance
A connector creates a small air gap that reflects light. EXFO’s OTDR guide gives these typical values:
- UPC connectors: –45 to –55 dB
- APC connectors: –55 to –65 dB
- An open UPC end: around –14.7 dB
A connector reading much higher (closer to 0 dB) than its type suggests is usually dirty or damaged. Inspect and clean it before you suspect the cable.
Gainers and ghosts: the two events that fool beginners
A gainer looks like the fiber gained power. It happens when the fiber after a splice scatters more light back than the fiber before it. A common case is splicing G.652.D to G.657.A fiber. Tested from the other end, the same splice shows extra loss instead. The FOA explains that the true splice loss is the average of the two directions. Never re-splice a joint based on a one-direction reading.
A ghost is an echo of a strong reflection that bounces back and forth in the fiber. It appears as a reflective event with almost no loss. It sits at a multiple of the distance to a real reflective event, often the launch connector. Index-matching gel or a cleaner, lower-reflection connection usually makes it disappear.
How to Read the OTDR Event Table
The trace shows you the shape. The event table gives you the numbers. On the F7, each row has these columns:
- Dis. (km): distance from the OTDR to the event.
- Loss (dB): loss at that event.
- Reflex (dB): reflectance. It is blank (“—–”) for non-reflective events.
- Slope (dB/km): attenuation of the fiber section before the event.
- Total loss (dB): loss accumulated from the start of the trace up to that event.
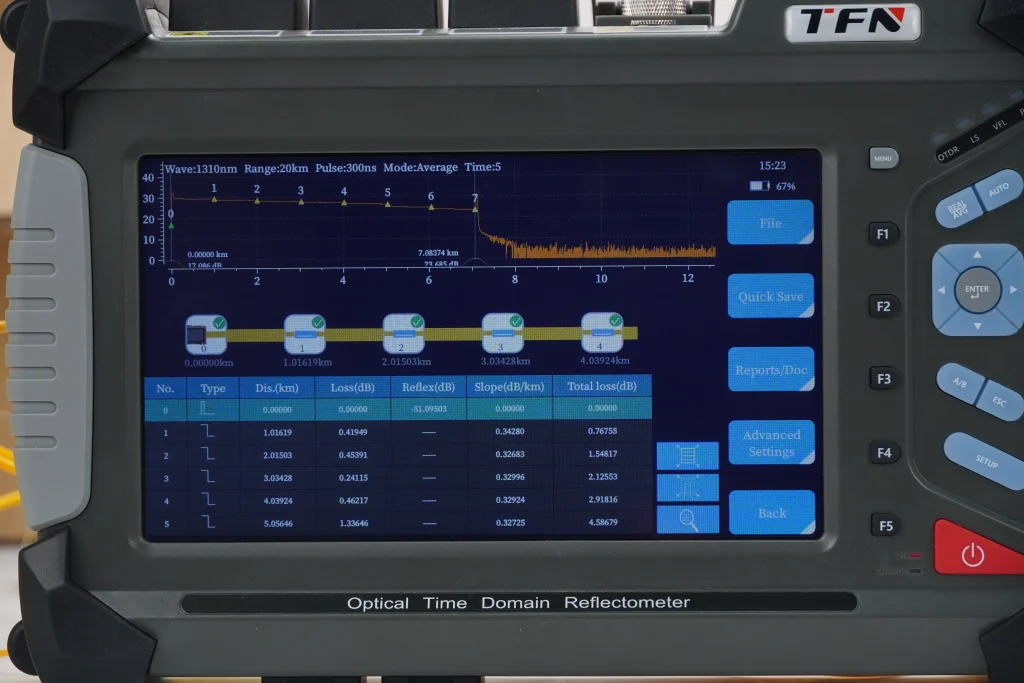
You can check that the table adds up. At 1310 nm, the six event losses on this link are 0.42, 0.45, 0.24, 0.46, 1.34 and 0.86 dB. Together they come to about 3.78 dB. The table’s total loss at the end is 6.12 dB. That leaves about 2.34 dB of plain fiber loss over 7.08 km, or roughly 0.33 dB/km, which matches the slope column.
When the numbers reconcile like this, the analysis is trustworthy. When they don’t, look for a merged event or a cursor placed in the dead zone.
Use Two Wavelengths to Find Bends
A single wavelength tells you that loss exists. Two wavelengths tell you what kind of loss it is. Bends leak more light at longer wavelengths. So an event that grows clearly at 1550 nm compared with 1310 nm points to a macrobend, not a poor splice.
Here is the same link at both wavelengths, taken from the F7 screens:
| Event | Distance | Loss at 1310 nm | Loss at 1550 nm | Reading |
|---|---|---|---|---|
| 1 | ~1.01 km | 0.42 dB | 3.06 dB | Grows ~7×: bend signature |
| 2 | ~2.02 km | 0.45 dB | 2.48 dB | Grows ~5×: bend signature |
| 5 | ~5.06 km | 1.34 dB | 1.70 dB | High at both: poor splice |
| 6 | ~6.07 km | 0.86 dB | 0.94 dB | Little wavelength dependence |
Normal fiber loss behaves the other way. Section slope falls from about 0.33 dB/km at 1310 nm to about 0.19 dB/km at 1550 nm. So when an event rises sharply at 1550 nm while the fiber gets cleaner, that contrast is the bend signature.
The F7 runs this comparison automatically. On its dual-wavelength event map, events 3 and 4 carry a macrobend icon, while events 5 and 6 are shown as splices. The verdict comes from the analysis, not from guesswork.
Settings That Change What You See
The same fiber can look clean or noisy depending on setup. If a trace doesn’t make sense, check these settings before blaming the fiber.
- Pulse width. Short pulses separate closely spaced events but don’t reach far. Long pulses reach far but merge nearby events and widen dead zones. Use the shortest pulse that still reaches the far end with a readable trace. The F7 offers 3 ns to 20 µs.
- Range. Set it beyond the link length. Too short a range cuts off the end, and too long a range wastes resolution. EXFO suggests about 120% of the expected length.
- Averaging time. More averaging lowers noise and lets you see low-loss splices. If the far end of the trace is fuzzy, increase averaging before you increase the pulse.
- IOR. A wrong index of refraction shifts every distance. Use the value from the cable datasheet.
- Launch and receive fibers. Without a launch fiber, the first connector is hidden in the OTDR’s dead zone, and without a receive fiber, the last connector can’t be measured. With both fitted, you can measure loss at both end connectors of the link.
- Dead zones. These set how close two events can be before they merge. The F7-S4, for example, specifies a 0.8 m event dead zone and a 4 m attenuation dead zone.
Field Example: Finding the Cause of a High-Loss Event
The numbers below are the real ones from the link above. The field story around them is an illustrative scenario.
A contractor finishes a 7 km feeder with a splice closure about every kilometre and runs a 1310 nm acceptance test. Only one event stands out: event 5 at 5.06 km, 1.34 dB, about three times its neighbours. Events 1 to 4 look fine at 0.24–0.46 dB.
Based on that single wavelength, the obvious plan is to remake splice 5 and sign off. The 1550 nm test tells a different story:
- Events 1 and 2 jump to 3.06 dB and 2.48 dB. They were nearly invisible at 1310 nm. This is the classic macrobend pattern. The OTDR also flags the neighbouring events 3 and 4 as macrobends.
- Event 5 rises only slightly, to 1.70 dB. Its loss is high at both wavelengths, so the problem is the splice itself.
The crew goes to the closures near 1, 2, 3 and 4 km and finds fiber coiled too tightly in the splice trays. They re-dress the fibers without re-splicing. At 5 km they remake the high-loss splice. A retest at both wavelengths then shows all events in line.
The lesson from this example: a link that looks acceptable at 1310 nm can fail in service at 1550 nm. Testing at a second wavelength takes about a minute. Finding bend loss after the customer’s 1550 nm traffic goes live takes much longer.
Event Map vs Raw Trace: Which One to Trust?
An event map turns the trace into icons on a straight line, with a pass/fail mark on each. It is the fastest way to report a result. It is also the fastest way to miss something. The map only shows what the analysis algorithm detected, using the thresholds you set.
A safe routine:
- Read the plan de l'événement for a quick verdict.
- Check the event table for any loss or reflectance near the limit.
- Open the raw trace whenever an event fails, sits close to its threshold, or the link length looks wrong.
- For acceptance reports, save the trace as an industry-standard SOR file. That way it can be compared at the next maintenance visit, or opened in third-party software.
Set pass/fail thresholds to the project specification before testing. Default values on any OTDR are a starting point, not a contract requirement for your link.
A spike is a reflective event. Light hit a refractive-index change, typically a connector air gap, a mechanical splice, a crack or an open fiber end. Check its reflectance value. A reading well above the normal range for that connector type usually means contamination or damage.
The fiber after the splice scatters more light back than the fiber before it, usually because of a mode field diameter mismatch. The splice did not create power. Test from both ends and average the two readings to get the real loss.
Bends lose much more light at longer wavelengths, while splice loss changes little. Comparing the two wavelengths separates bend problems from splice problems at the same location.
It sits inside the OTDR’s dead zone. Add a launch fiber so the first connector of the link appears clearly after the dead zone.