


With the dense deployment of urban base stations and the rapidly growing demand for telecommunications services, mobile operators often face various types of interference that degrade network quality. As spectrum utilization intensifies, identifying and resolving interference becomes crucial to maintaining stable and reliable communication.
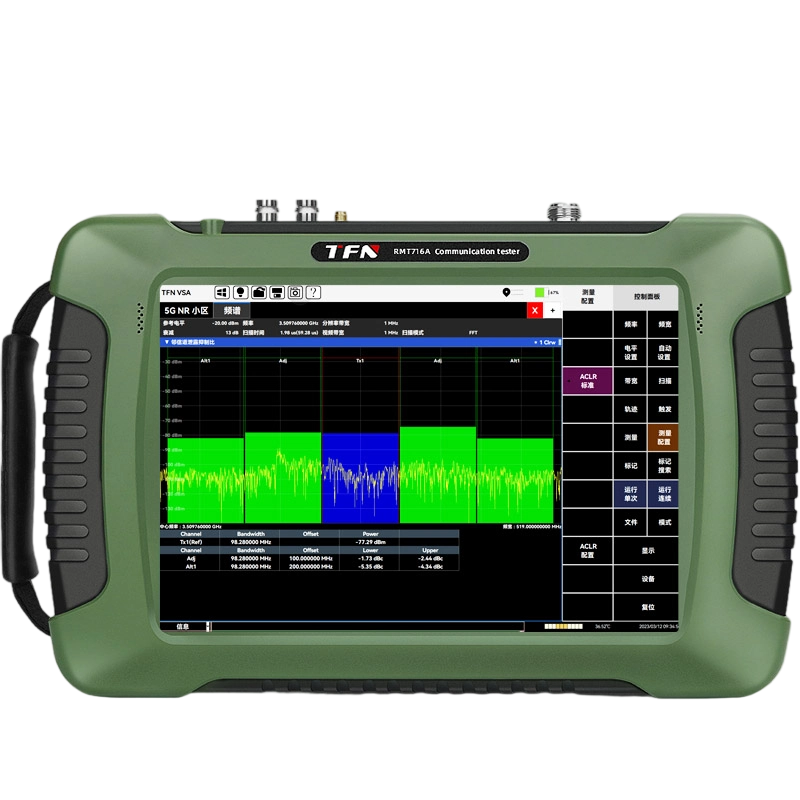
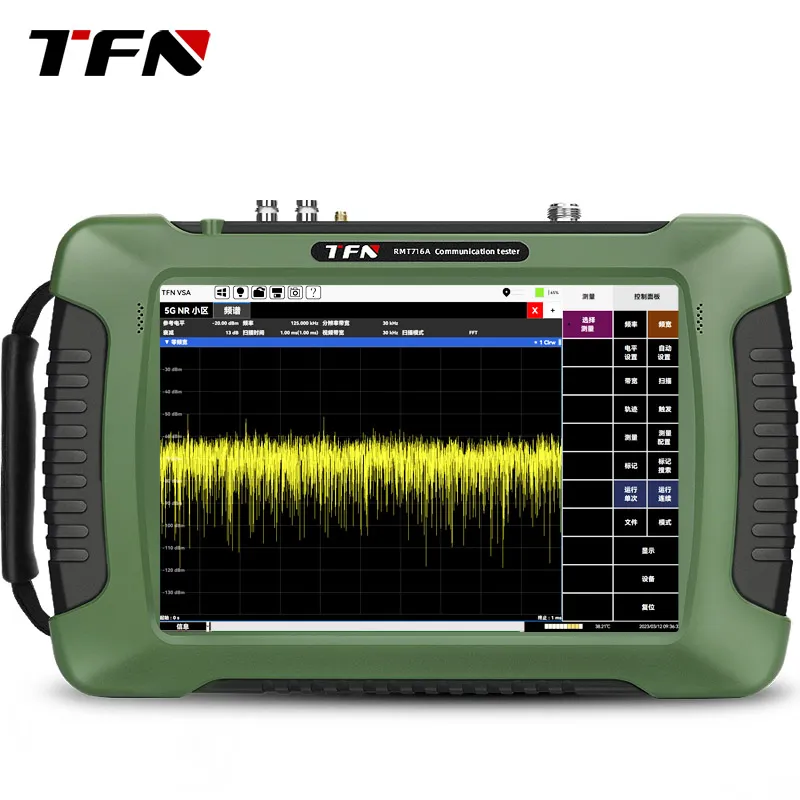
To address interference issues in backbone point-to-point wireless links and improve overall signal performance, TFN developed the RMT-series handheld spectrum analyzers, which offer advanced interference location and analysis capabilities in a portable form factor.
Here are steps to detect and locate interferences:
- Confirm the presence of interference using the spectrum analyzer.
- Identify the interference type by analyzing known signals in the environment.
- Locate the interference source by connecting a directional antenna to the analyzer.
- Eliminate or mitigate the interference based on analysis results.
The RMT spectrum analyzer integrates seven measurement modes that enable fast, visual, and accurate analysis of interference signal amplitude, frequency, status, and location.
1. Persistence Spectrum
The persistence display visualizes how often a specific spectrum appears over time. Frequency is shown on the horizontal axis, amplitude on the vertical, and color indicates signal probability — from red (100%) to blue (0%). This mode allows engineers to easily detect weak signals hidden beneath stronger ones, providing a clear view of signal dynamics and occurrence frequency.
2. Signal Strength Measurement
When paired with a directional antenna, the analyzer measures signal strength from different directions, helping identify the direction of interference sources.
3. Waterfall Display
The waterfall view presents a 3D visualization of frequency, amplitude, and time, allowing users to easily observe periodic or intermittent interference. Color variations indicate signal amplitude intensity.
4. Outdoor Map Measurement
This mode supports RSSI and ACLR testing outdoors, plotting test results in real time based on GPS coordinates or movement paths, forming trajectory records for precise signal tracking.
5. RSSI Measurement
RSSI mode measures how a signal’s strength changes at a fixed frequency over a specific period, helping evaluate signal stability and interference fluctuation.
6. Indoor Map Measurement
Ideal for environments without GPS signals, the indoor map option allows users to manually mark measurement points while performing RSSI or ACLR tests. All data can be saved for later review and analysis.
7. Time Gate Measurement
The time gate (Gatetime) function isolates mixed or overlapping signals by setting precise time windows. This helps measure specific signals while filtering out unwanted interference — highly practical for complex RF environments.
Wireless transmission systems are often affected by multiple interference sources. A handheld spectrum analyzer with a directional antenna provides the most convenient and effective method for identifying and locating these sources.
With its multi-mode analysis functions, the TFN RMT series spectrum analyzer enables engineers to quickly locate and characterize interference, helping them restore communication systems to optimal performance with accuracy and efficiency.
Model Options and Frequency Ranges
The RMT spectrum analyzers are available in multiple frequency bands. Interference analysis and location functions are standard across all models. Optional directional antenna kits are also available for different frequency ranges. If you would like to learn more, click here to check details.