





Most OTDR guides spend the first half telling you what an OTDR is. You already know — you’re standing at a splice enclosure with a live deadline and a reel of fiber that may or may not be good.
This guide skips the classroom and gets straight to what you actually do on site. Nine steps, in order, with the reasoning behind each one so you know when to adjust rather than just follow a checklist blindly.
If you want the underlying physics first, that’s covered in How Does an OTDR Work? and OTDR Dead Zone Explained. Otherwise, let’s start with the gear.
Before You Touch the OTDR: The One Thing Most Technicians Skip
Clean the connectors. Every single one. Before anything else.
This isn’t a formality. Contaminated connector endfaces are the single most common cause of inflated loss readings, and — critically — they can permanently damage your OTDR’s optical port. A dirty connector reflects a fraction of the laser energy straight back into the detector. Do that enough times and the detector degrades.
The process: inspect with a fiber inspection scope or digital microscope, then clean with a lint-free wipe or click-style cleaner, then inspect again. Never skip the second inspection. A “cleaned” endface with debris still on it is worse than one you haven’t touched, because now you assume it’s fine.
Clean: the OTDR launch port, the launch cable connectors, and the fiber under test — at both ends if you have access. Two minutes of cleaning here saves two hours of chasing phantom losses later.
Step 1 — Connect Your Launch Cable
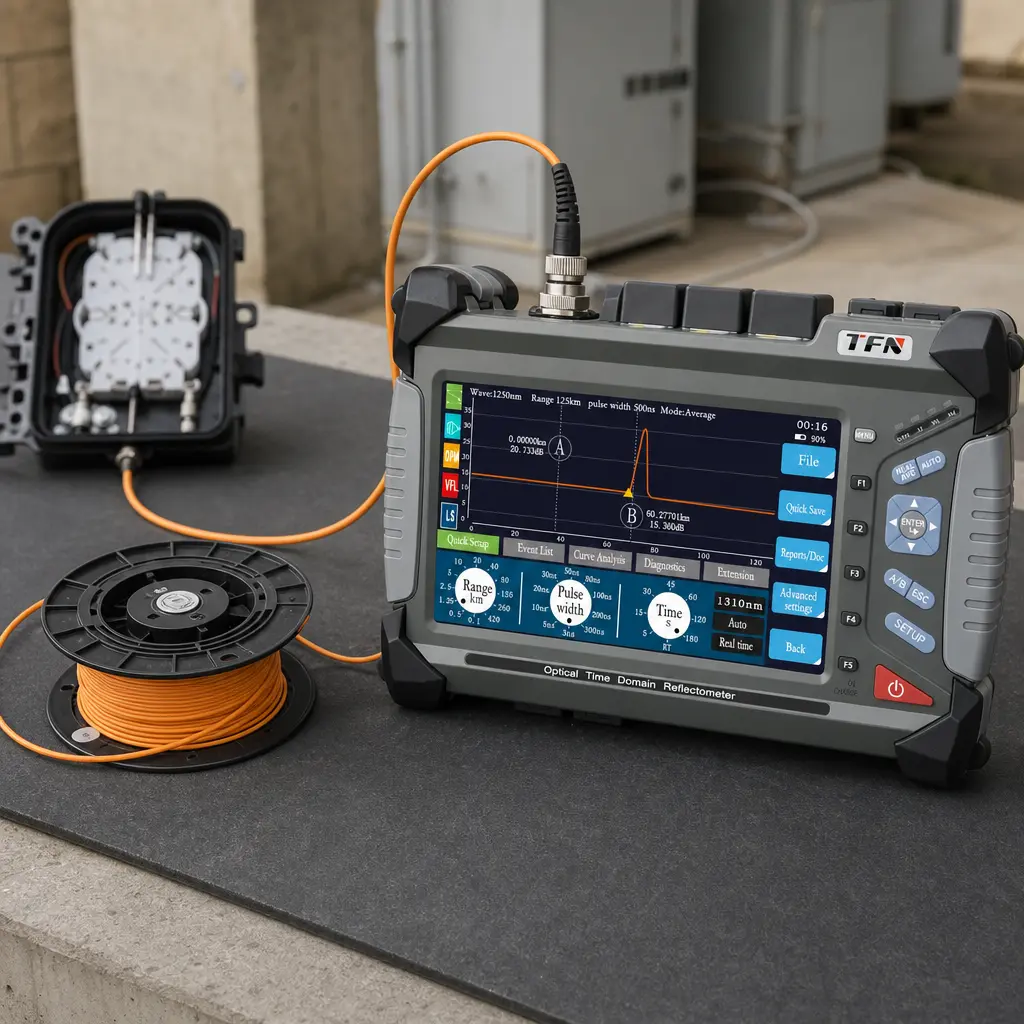
Plug a launch cable between the OTDR and the fiber under test before you do anything else.
The reason: every OTDR has a dead zone right at its front panel — the reflection from its own launch connector briefly blinds the detector, making it impossible to accurately measure the first connector on your fiber link. A launch cable (typically 100 m to 500 m of fiber on a spool) moves that dead zone into the cable before your link starts, so your first real connector falls where the OTDR can actually see it.
If you’re testing a short link with connectors at both ends, add a receive cable at the far end too, for the same reason.
Without a launch cable, your test report has a gap at exactly the wrong place — the connector your customer is most likely to ask about.
Step 2 — Power On and Let It Warm Up
Turn the OTDR on and give it 1–2 minutes before running a test. Laser diodes produce slightly different output when they’re cold. On short, low-loss links the difference is negligible; on long-haul or sensitive measurements, a warm unit gives you a cleaner trace baseline.
While it’s warming up, note the battery level. An OTDR that shuts off mid-test doesn’t save partial results on most units — you restart from scratch.
Step 3 — Set the Wavelength
Match the wavelength to your fiber type and the measurement goal:
Single-mode fiber:
- 1310 nm — standard choice for installation and acceptance testing. Lower sensitivity to bending losses means you see the fiber’s intrinsic events (splices, connectors) more clearly without macro-bend noise.
- 1550 nm — use when you’re checking for bending or stress. At 1550 nm, the light is more loosely guided in the core, so bends show up as clear loss steps that would be invisible at 1310 nm. For long-haul links, also the relevant wavelength for operating loss calculations.
- Both — best practice for full certification. Comparing 1310 nm and 1550 nm traces together reveals bending issues that one wavelength alone won’t show.
Multimode fiber:
- 850 nm for data center and short building runs
- 1300 nm for longer multimode links
Wrong wavelength = valid-looking trace, wrong conclusions. This is especially common when contractors inherit a fiber plant and assume the previous installer documented the fiber type correctly.
Step 4 — Set the Range
Set the distance range to 1.5 to 2 times the actual fiber length.
If your fiber is 10 km, set the range to 15–20 km. If you set it too short, the OTDR cuts off the trace before the far end appears and you miss the end-of-fiber reflection entirely. If you set it far too long, the OTDR spreads its sampling resolution across a larger window and you lose the fine detail you need to resolve closely spaced events.
When you don’t know the fiber length, start with the longest available range, locate the far end, then re-run at 1.5–2× that length for a cleaner trace. On a unit like the F7 with a 125 km range option, a “run at auto first, then refine” approach works well.
Step 5 — Set the Pulse Width
This is the setting most new technicians get wrong, and the consequences show up as either missed events or excessive dead zones.
The core trade-off: short pulses give better resolution but less range; long pulses reach farther but create larger dead zones.
A practical starting point:
| Link Length | Starting Pulse Width |
|---|---|
| < 5 km (data center, building) | 10–30 ns |
| 5–20 km (campus, access network) | 100–300 ns |
| 20–60 km (metro, feeder fiber) | 500 ns – 1 µs |
| > 60 km (long-haul, submarine) | 1–10 µs |
These are starting points, not hard rules. If you’re using a short pulse and the signal disappears before the far end, increase the pulse width. If your dead zones are swallowing events near the beginning or end, reduce it.
On the F7, the pulse width dial on the lower screen lets you step through options while watching the trace live in Real-Time mode — a practical way to find the right setting before committing to an averaged run.
Step 6 — Set the Averaging Time and Run the Test
Set your measurement mode to Average rather than Real-Time.
Here’s why it matters: backscatter is a weak signal mixed with background noise. Real-Time mode shows you one measurement at a time — fast, but noisy. Average mode fires thousands of pulses, stacks the results, and statistically lifts the real signal out of the noise floor. The trace gets cleaner, your dynamic range increases, and marginal events near the far end become visible instead of disappearing into the noise.
Practical averaging times:
- 15–30 seconds for a quick check or short links
- 1–3 minutes for installation acceptance and certification testing
- 3–5 minutes for long-haul links or when the far end is barely visible
Longer averaging does not make the test more accurate near the OTDR — it only helps pull weak signals out of the noise at long distances. Don’t sit there averaging for five minutes on a 500 m patch cord.
Hit the test button, wait for the run to complete, then look at the full trace before saving anything.
Step 7 — Check the Trace Before You Accept It
A test that ran successfully is not the same as a test that gave you useful data. Before saving, spend 60 seconds on these checks:
Is the far end visible? You should see a clear end-of-fiber reflection (a spike) followed by a drop to the noise floor. If the trace just fades into noise without a clear end spike, the link is either longer than your range setting, or there’s a fault cutting off the signal before the far end.
Is the opening dead zone past your first event? If the first connector on your fiber appears inside the dead zone — right at the start of the trace — your launch cable may be too short, or you may not have one connected at all.
Does the backscatter slope look continuous? The descending line should be a clean, approximately straight slope from left to right. A sudden change in slope — a kink — suggests a point where the fiber character changes: a joint between different fiber types, a tight bend, or water ingress.
Are there unexpected spikes mid-trace? Unplanned reflective events between your marked splice locations usually mean a connector was left in the path, or a mechanical splice was used where you expected a fusion splice.
If any of these look wrong, don’t save and move on. Investigate before recording the trace as your acceptance measurement.
Step 8 — Read and Mark the Events
Once the trace looks good, use the OTDR’s event analysis mode (called “Event List” on the F7) to identify and label each feature:
- Connector — marked by a reflective spike with an associated loss step. Acceptable connector loss for SC/APC connectors is typically under 0.3 dB; anything over 0.5 dB deserves a clean-and-retest before you record it.
- Fusion splice — a loss step with no spike (or a very small one). Well-executed fusion splices on single-mode fiber typically measure below 0.05 dB. Above 0.1 dB is worth flagging.
- Fiber section loss — the slope between events. Single-mode fiber at 1310 nm should run around 0.35 dB/km; at 1550 nm, around 0.20–0.22 dB/km. A steeper slope between two events points to fiber quality issues or physical stress in that span.
- End of fiber — the final spike and drop. Note the distance.
- Total link loss — the cumulative loss from start to end, often shown automatically. Compare this against your link loss budget.
If the F7’s automated event map flags a connector with a red X (exceeding your threshold), that’s your punch list before final sign-off.
Step 9 — Save the Trace and Generate a Report
Save the raw trace file in the OTDR’s native format (.sor is the standard, readable by most analysis software). Then export a readable report — the F7 outputs PDF reports directly from the device.
What to include in your test record:
- Date, time, and technician name
- Fiber ID and cable route
- OTDR model and serial number
- Test wavelength(s)
- Pulse width, range, and averaging time used
- Full trace image
- Event table with distances, loss values, and reflectance
- Pass/fail determination against the link loss budget
Don’t hand over a test report with no parameter information. A trace without its settings tells your customer nothing about whether the measurement is trustworthy. It also makes it impossible for you to reproduce the measurement if a dispute comes up later.
For a full template of what a professional OTDR test report should contain, see OTDR Test Report: What to Include and Why.
Quick-Reference Parameter Table
| Link Length | Wavelength (SM) | Range | Pulse Width | Averaging |
|---|---|---|---|---|
| < 1 km | 1310 nm | 2–5 km | 3–10 ns | 15–30 s |
| 1–5 km | 1310 nm | 5–10 km | 10–30 ns | 30 s |
| 5–20 km | 1310 / 1550 nm | 20–40 km | 100–300 ns | 1–2 min |
| 20–60 km | 1310 / 1550 nm | 40–100 km | 500 ns – 1 µs | 2–3 min |
| > 60 km | 1550 nm | 100–160 km | 1–10 µs | 3–5 min |
These are practical starting points. Adjust based on what you see in the trace.
Frequently Asked Questions
Yes, unless you genuinely don’t care about the first connector on your link. The OTDR’s own launch dead zone will fall right at that first connector without one. For acceptance testing or any work that gets signed off, a launch cable is non-negotiable.
Real-Time mode updates the trace continuously — useful for watching a live connection while you move a cable or adjust something. Average mode stacks thousands of measurements to reduce noise. Run Real-Time to dial in settings, then switch to Average for the measurement you record.
Almost certainly a macro-bend — fiber bent tighter than its minimum bend radius somewhere in the span. Long wavelengths are more susceptible to bending losses. Walk the route and look for kinks, tight loops in splice enclosures, or cable pulled over sharp edges.
If the trace starts with a spike that immediately drops into the noise before resolving into a stable backscatter slope, your first event is inside the dead zone. Add a longer launch cable to push that dead zone further back.